
Blog Contents - Who am I? Blog Category - Mathematical Functions
The whole purpose of science is to find meaningful simplicity in the midst of disorderly complexity. Herbert A. Simon, Models of My Life (1991)
Exponential and logistic functions describe the time development of a quantity under specified conditions. These functions are valid in a large number of situations - I present a mathematical derivation/description of their properties which is suitable for anybody who has a basic understanding of school level mathematics.
By not using the phrase - may be shown - I hope this presentation will provide a better appreciation of this important subject.
(Click on the slide to view full page image, ESc to return to the text)
The Exponential Function (EF) - limitless growth


I have discussed exponential growth in detail in a previous blog and refer you to this source for a comprehensive description. A good example of exponential growth is the nuclear chain reaction in an atomic bomb - the number of fission events and hence energy generated grows exponentially and explosion happens well before the device runs out of fissile material.
Exponential growth is a fascinating subject and I have expanded the discussion at the end of this blog. For worked out examples - click here.
The Logistic function or the S-Curve
(Resource limited growth)
Resource limited growth is a much more common situation found in many physical systems where the amount of energy, food, space, number of consumers etc. has limits. The result is that after a certain time, the growth is restricted; eventually (asymptotically) reaching a zero rate.
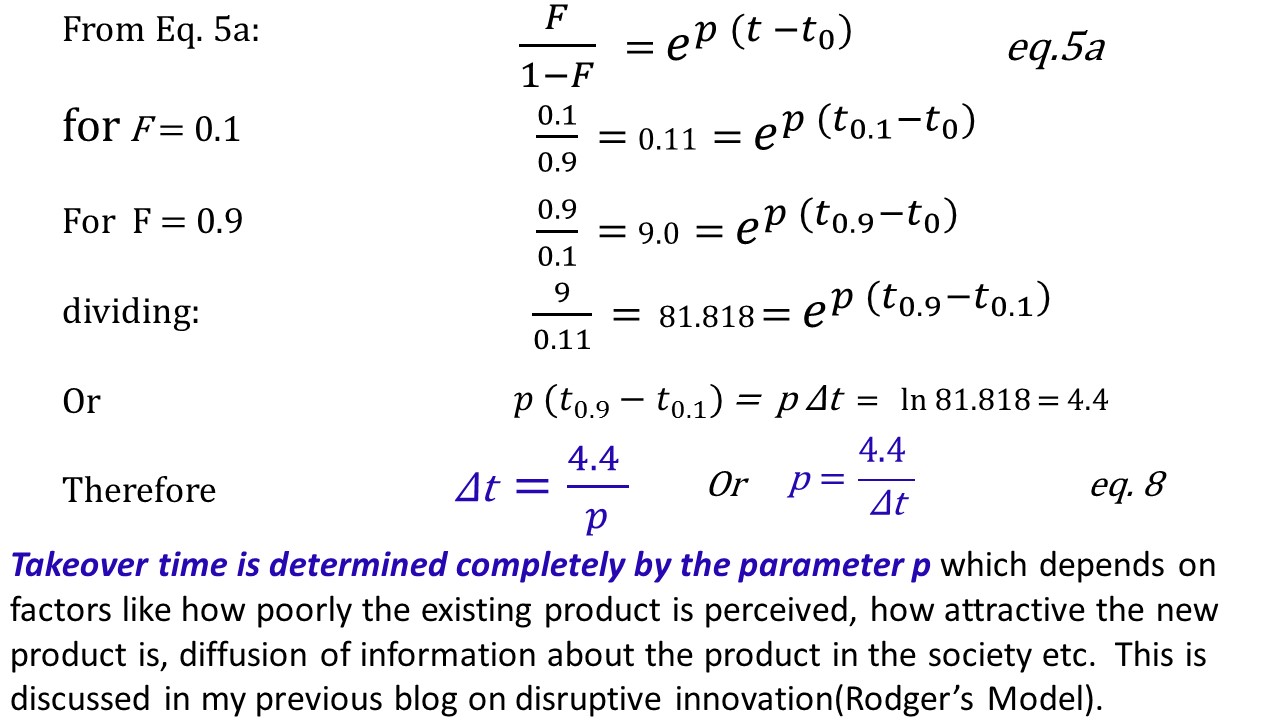
In the initial stages of growth, its works just like the exponential growth as there are sufficient resources but once roughly half of the resources are used, the growth starts to be restricted and the quantity deviates from the exponential function and is described by what we call the S-curve or the logistic function. I shall set up the mathematics of the logistic function in the following. For ease of presentation, I shall consider the substitution of an established business (incumbent) by a new entrant (disruptor) in an environment where the number of products to be sold is capped - The Fisher Pry Model. The results derived are of general applicability.
We assume that at the start the incumbent has a 100% market share with the cap at N products. The disruptor starts with 0% market share.
After time t (units could be days, months, years etc.), their market shares are
Disruptor -> D, Incumbent -> I such that D + I = N
It is convenient to work with fractional market shares as follows:
Disruptor -> F = D/N, Incumbent -> (1 - F) = I/N such that the total market share is unit.
Once established in the market place, the fraction rate of growth of the disruptor depends on how much market share still remains to be won and we consider that this is directly proportional to the remaining market share (1 - F ) (remember in exponential growth the fractional rate of growth was constant). The justification of this assumption is in its success in explaining substitution in a very large number of cases.


Returning to Exponential Growth with more details
There are three ways to describe exponential growth (EG) - they are equivalent but one is used in preference to others depending on the situation: In EG
1. Rate of change (% Change) depends on the amount present (Fractional rate of change is constant)
Annual interest rate is 5% (interest earned per year is 0.05 times the money at the start of the year).
Inflation index which measures the % change in the cost of a basket of goods over a year, was 2.5%.
Global population increased by 1.4% per year in the 20th Century.
E.Coli colony increases is size at 3.5% per minute. etc...
2. The quantity present doubles after a certain time.
(Doubling Time)
If you leave your money in a bond, it will double in 14 years
Inflation will double the cost of goods in 28 years.
Global population doubled every 50 years in the 20th Century.
E Coli colony doubles in size in 20 minutes. etc...
3. Doubling steps: Accumulate something with the added amount doubling in successive steps.
In 70 years, there were 5 doubling steps for your money - money grew by a factor of 2^5 = 32 times
In 56 years, inflation had two doubling steps - prices went up by a factor of 4
In 150 years, population had 3 doubling steps - grew by a factor of 8
In 12 hours, E Coli colony had 36 doubling periods and grew by 2^36 = 68.7 billion times
The important parameter in exponential growth is
% rate of change or doubling time.
Rate of change and doubling time are measured in the same units of time - be it years, minutes, seconds, centuries, nanoseconds or whatever.
They are simply related as follows (called the rule of 70):
% rate of change = 70 divided by the doubling time, and of course
The doubling time = 70 divided by the % rate of change
If we start with 1 unit and the doubling time is T then at time
10T the number of units will be 1,000 (actually 1024; I have rounded up the numbers)
11T 2,000
20T 1,000,000
30T 1,000,000,000
40T 1,000,000,000,000
41T 2,000,000,000,000
What quantity (population, money, no of transistors) and the unit of time (years, seconds, minutes etc.) you choose depends on the problem.
The thing to note is that at 10T after one doubling time, the growth was 1,000;
while at 40T after one doubling time, the increase was 1,000,000,000,000 - a billion times greater.
This is true of all systems showing exponential growth - this is simple maths.
Also note that in each doubling time, the increase is as much as has happened since the beginning (in all the previous doubling steps).
So when we say that energy consumption will double in 40 years; it means that in the next 40 years we shall consume as much energy as we have used since the beginning! To make it clearer:
From 1970 to 2010 we used as much energy as we had used from 1800 to 1970. (1800 is chosen as a reference point - energy used before 1800 was very small)
If we were to plot the quantity against time then the graph will show very little change in the beginning but after 10 or 20 doubling times the numbers would have grown to thousands of times bigger and the graph will show an almost vertical swing. For EG to really take off, one needs to wait for about 30 doubling times but then the absolute growth is at a phenomenal level. For some worked out examples, click here.
If you found this blog interesting then let me know at ektalks@yahoo.co.uk
No comments:
Post a Comment